THE CASE FOR
TRANSIT-ORIENTED COMPLETE COMMUNITIES
KEY FINDINGS
Investments in public transit
are vital to maintaining growth in Canada’s largest urban regions.
Communities are only complete
if they are walkable.
Not all transit projects
deliver the same return.
The growth of Canada’s largest cities, continued?
Six ‘transit regions’ share of Canadian population
Figure 1 – Six ‘transit regions’ share of Canadian population
Source: Statistics Canada. Table 17-10-0148-01 Population estimates, July 1, by census metropolitan area and census agglomeration, 2021 boundaries
Canada’s largest metropolitan Regions (Toronto, Montreal, Vancouver, Calgary, Edmonton, and Ottawa) account for 56% of the Canadian population.
Figure 2 – Population growth by region size
Source: Statistics Canada. Table 17-10-0148-01 Population estimates, July 1, by census metropolitan area and census agglomeration, 2021 boundaries
These regions are also growing at a faster rate with 300,000 residents on average added each year between 2001 and 2025.
This is due primarily to job growth and immigration. The housing crisis in Canada by many measures is most acute in the largest cities. Polices at the federal, provincial, and municipal levels need to be sensitive to the structural differences between localities when crafting policies and making infrastructure investments. Building higher order public transit is one of the most impactful measures governments are making that directly addresses the housing shortages in Canada’s largest cities. Investments in public transit are about much more than transportation, they are foundational investments in city building.
Canada’s urban economy
Figure 3 – Growth in goods producing and servicing producing sectors.
Source: Statistics Canada. Table 14-10-0355-01 Employment by industry, monthly, seasonally adjusted and unadjusted, and trend-cycle, last 5 months (x 1,000)
Job growth has been one of the main drivers of population growth in Canada’s urban regions. The six transit regions have added 2.6 million jobs since 2011 representing 2 out of every 3 net new jobs in the country. This runs counter to the long-standing popular narrative that Canada’s economic engine is driven by the natural resource sector. While goods production (i.e. agriculture, natural resources, manufacturing) do account for a much larger share of exports, they account for far fewer direct jobs. Over the past 50 years job creation in goods producing sectors has been largely flat, adding only 900 thousand positions. That is in stark contrast with service producing sectors which have added over 10 million jobs over the same time-period. Service industries are mainly dependent not only on people, but on the relationships between them. Despite advances in digital communications technologies, operating in close physical proximity still offers significant advantages. The key point is that service sector job growth skews towards the largest urban areas, and even more specifically, towards the downtowns of big cities.
Gateway cities
Share of immigration by geography
Figure 4 – Share of immigration by geography 2001-2025
Source: Statistics Canada. Table 17-10-0149-01 Components of population change by census metropolitan area and census agglomeration, 2021 boundaries
The other main driver of population growth is immigration. The six largest urban regions are home to three quarters of all immigrants in Canada. While people tend to be drawn to economic opportunities, newcomers also seek out communities that provide social and cultural supports. Over the past few decades, there has been a self-reinforcing cycle of more jobs, attracting more people, which in turn attract more jobs, resulting in the largest Canadian cities growing at a faster rate than the rest of the country.
The need for housing in Canada’s largest urban regions
Housing affordability in the largest CMAs
Figure 5 – Housing affordability in the largest CMAs
To meet the needs of a growing population, the Canada Housing and Mortgage Corporation projects that Canada needs to almost double its annual housing production to 480,000 new homes per year over the next decade to make housing affordable for Canadians. The need is experienced most acutely in Canada’s largest cities and regions. For example, to meet these national targets, Toronto needs to increase annual housing starts by 71%, Montreal by over 200%, Calgary by 45% and Ottawa/Gatineau by 155%. In total, just over 50% of the required housing is in Canada’s largest six metropolitan areas. The CMHC predicts that demand for housing and housing prices will continue to increase at a higher rate in those places for the foreseeable future.
The need for higher order public transit in Canada’s largest urban regions
Commute times in the largest urban regions
Figure 6 – Commute times in the largest urban regions
Source: Statistics Canada. Table 98-10-0465-01 Main mode of commuting by commuting duration, time leaving for work, industry sectors, occupation broad category and gender: Canada, provinces and territories, census metropolitan areas and census agglomerations with parts
Investments in public transit are vital to maintaining growth in the largest urban regions. As demand rises for land it becomes more valuable, putting upward pressures on costs. In this scenario, housing projects can quickly become unviable. Building at higher densities can help overcome this obstacle, but as large cities grow in this manner, they become harder to move through. Friction of movement simultaneously reduces cities’ economic advantage and diminishes quality of life. The Toronto Region Board of Trade estimates that congestion in the Greater Toronto and Hamilton Region is costing the economy $44B per year. Investments in public transit infrastructure is the most effective solution to these problems. They improve mobility and quality of life which are reflected in associated land values which in turn attracts further private sector investment in housing construction. If it becomes too difficult to move through cities, people tend to start moving out of them.
There are six regions with higher order public transit infrastructure with a seventh in planning stages (Quebec).
In these six regions there are 12 LRT lines, 10 subway/metro lines, and 14 commuter rail lines. There are 4 LRT lines under construction with an additional 4 in the planning stages. There is one subway line under construction as well as a range of additions and upgrades to commuter rail.
In total there are 465 higher order transit stations with an additional 298 under construction or in the planning stages. 5.59 million people currently live with 800m of a higher order transit station.
Maximizing the impacts of transit investments on new home development
Transit-Oriented Development by Select Municipalities 2001-2021
Figure 7 – Transit-Oriented Development by Select Municipalities (Existing stations)
Source: Statistics Canada. Table 98-10-0002-01 Population and dwelling counts: Canada and census subdivisions (municipalities)
Not all transit projects deliver the same return however, in terms of spurring home building. Market demand for transit-oriented development is not equal between cities, transit lines within cities, or even transit stations across lines. Each location possesses unique characteristics that provide varying appeal to future residents. Relative demand versus land supply also plays a significant factor, with the core municipalities of the three largest urban regions (Toronto, Montreal, Vancouver) seeing most new home construction close to major transit stations, while the next three largest (Calgary, Edmonton, Ottawa) still experience more building outside of transit station areas.
Building & Development by Transit Line
Figure 8 – Housing development trajectories of Line 5 and Line 6 in Toronto
Two recently opened LRT lines in Toronto (Line 5 and Line 6) offer an example of divergent housing construction trajectories within the same municipal context with 140,844 new homes currently under construction or proposed for the Line 5 corridor and 23,430 units in the pipeline for Line 6.
Proposed & Under Construction Units by Line 5 Station
Figure 9 – Housing pipeline for Line 5 in Toronto
Line 5 further demonstrates the variance of housing construction along its length with some stations seeing modest levels of home building in contrast to a handful that each have 25,000 or more units proposed to be built within 800m.
Six ‘transit regions’ share of Canadian population
Figure 1 – Six ‘transit regions’ share of Canadian population
Source: Statistics Canada. Table 17-10-0148-01 Population estimates, July 1, by census metropolitan area and census agglomeration, 2021 boundaries
Figure 2 – Population growth by region size
Source: Statistics Canada. Table 17-10-0148-01 Population estimates, July 1, by census metropolitan area and census agglomeration, 2021 boundaries
Figure 3 – Growth in goods producing and servicing producing sectors.
Source: Statistics Canada. Table 14-10-0355-01 Employment by industry, monthly, seasonally adjusted and unadjusted, and trend-cycle, last 5 months (x 1,000)
Share of immigration by geography
Figure 4 – Share of immigration by geography 2001-2025
Source: Statistics Canada. Table 17-10-0149-01 Components of population change by census metropolitan area and census agglomeration, 2021 boundaries
Housing affordability in the largest CMAs
Figure 5 – Housing affordability in the largest CMAs
Commute times in the largest urban regions
Figure 6 – Commute times in the largest urban regions
Source: Statistics Canada. Table 98-10-0465-01 Main mode of commuting by commuting duration, time leaving for work, industry sectors, occupation broad category and gender: Canada, provinces and territories, census metropolitan areas and census agglomerations with parts
Transit-Oriented Development by Select Municipalities 2001-2021
Figure 7 – Transit-Oriented Development by Select Municipalities (Existing stations)
Source: Statistics Canada. Table 98-10-0002-01 Population and dwelling counts: Canada and census subdivisions (municipalities)
Building & Development by Transit Line
Figure 8 – Housing development trajectories of Line 5 and Line 6 in Toronto
Proposed & Under Construction Units by Line 5 Station
Figure 9 – Housing pipeline for Line 5 in Toronto
Market forces and planning policies
Market forces are not the only consideration that shapes what gets built where. To maximize the home building return on higher order transit investments, provinces and municipalities can work together to align planning regulations. In making fiscal contributions to transit infrastructure projects, the federal government may also attach conditions to the funding so that planning policies work to support the investment by encouraging nearby housing construction.
In some contexts, policies that permit higher densities may not be enough to spur significant home building. Calgary, Edmonton, and Ottawa continue to experience more development outside of transit station areas than inside. Much of this occurs in greenfield contexts as land is still relatively plentiful and transportation congestion issues have not reached the problematic levels found in the largest urban regions. However, car- centric greenfield developments often act to undercut the support for transit investments, making it more difficult for cities to make the case for transit as a foundation for how and where the city grows.
There are a number of policy options to steer more development to transit station areas. One, would be to increase land use restrictions in greenfield areas. Additionally, provinces and municipalities can create incentives to build near transit through reduced municipal fees, including development charges. A third option is to further invest in building amenities within transit station areas so to make them more attractive to prospective residents — to create Transit-Oriented Developments.
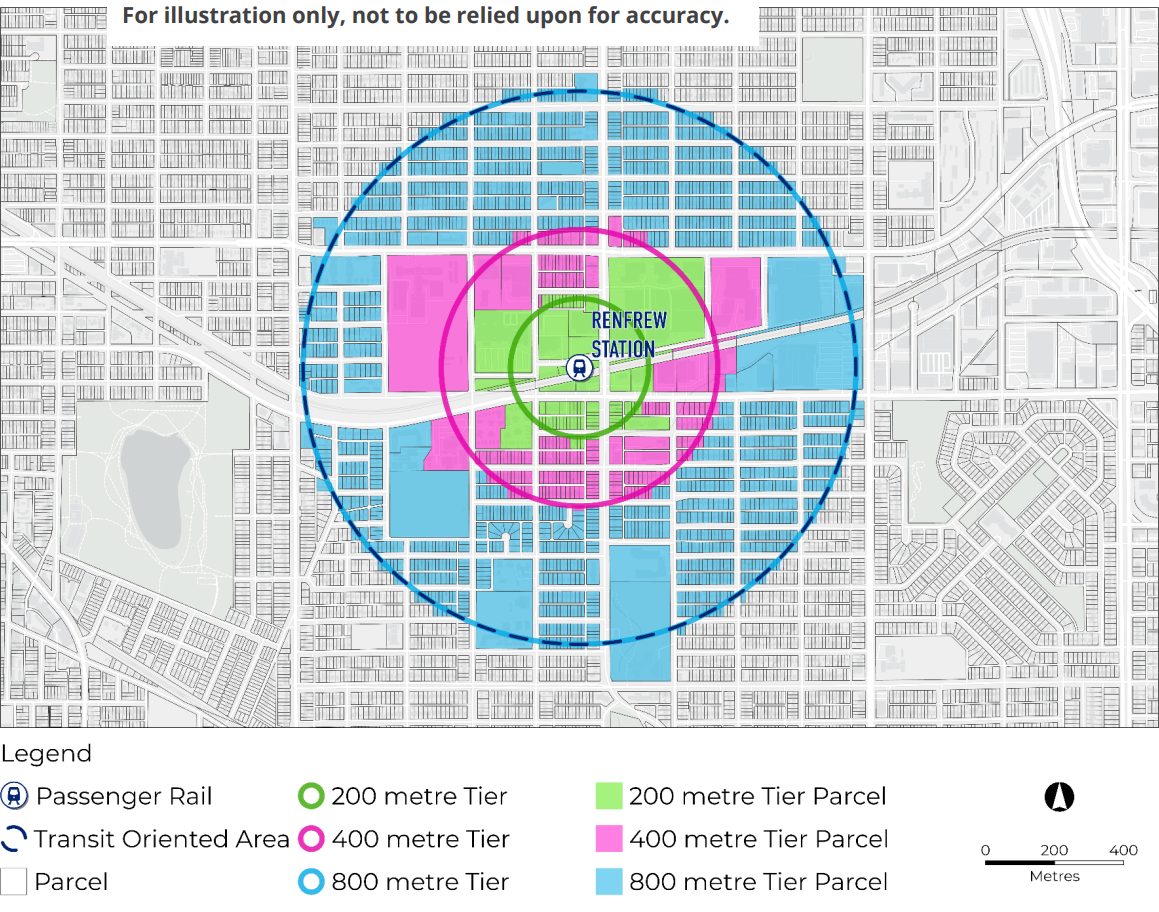
Figure 10a – Examples of Transit Station Zoning Policies
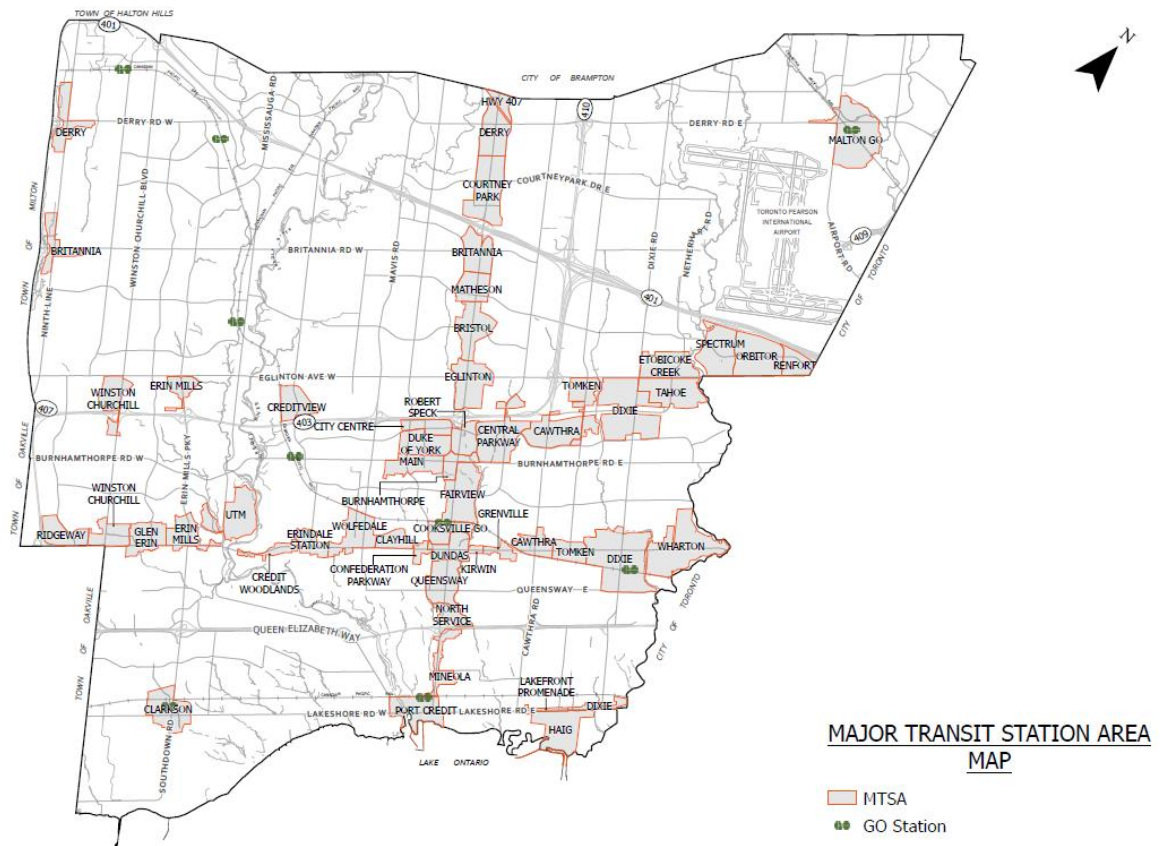
Figure 10b – Examples of Transit Station Zoning Policies
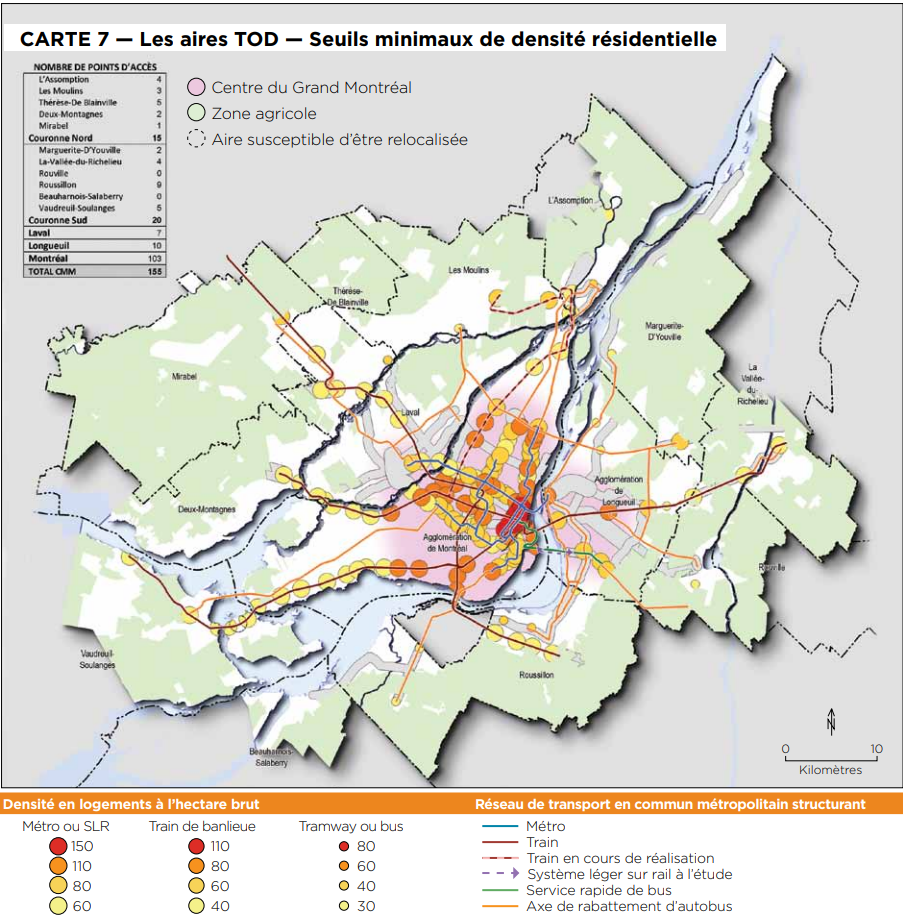
Figure 10c – Examples of Transit Station Zoning Policies
Source: https://cmm.qc.ca/wp-content/uploads/2019/03/pmad_plan_metropolitain_amenagement_developpement.pdf
Transit-Oriented Complete Communities
People’s choice on where to live is based on a number of factors including- proximity to employment, transit and housing prices but also to what makes a neighbourhood inviting and vibrant, including access to good schools, parks and greenspace and local stores and restaurants To be successful in this regard, transit-oriented developments require a wide range of additional infrastructure. The concept of ‘complete communities’ is that people should be able to access the things they need in their day-to-day lives within a short walk from home. Grocery stores, schools, and doctors’ offices are examples of core assets of complete communities. Focusing civic infrastructure and local businesses close to stations will improve access and efficiency for both providers and users of the amenities. If transit-oriented communities are to be successful in the longer term, a clear accounting of the future needs of communities is required. Integrating the planning of neighbourhood services in conjunction with planning of new higher order transit infrastructure should lead to better results overall.
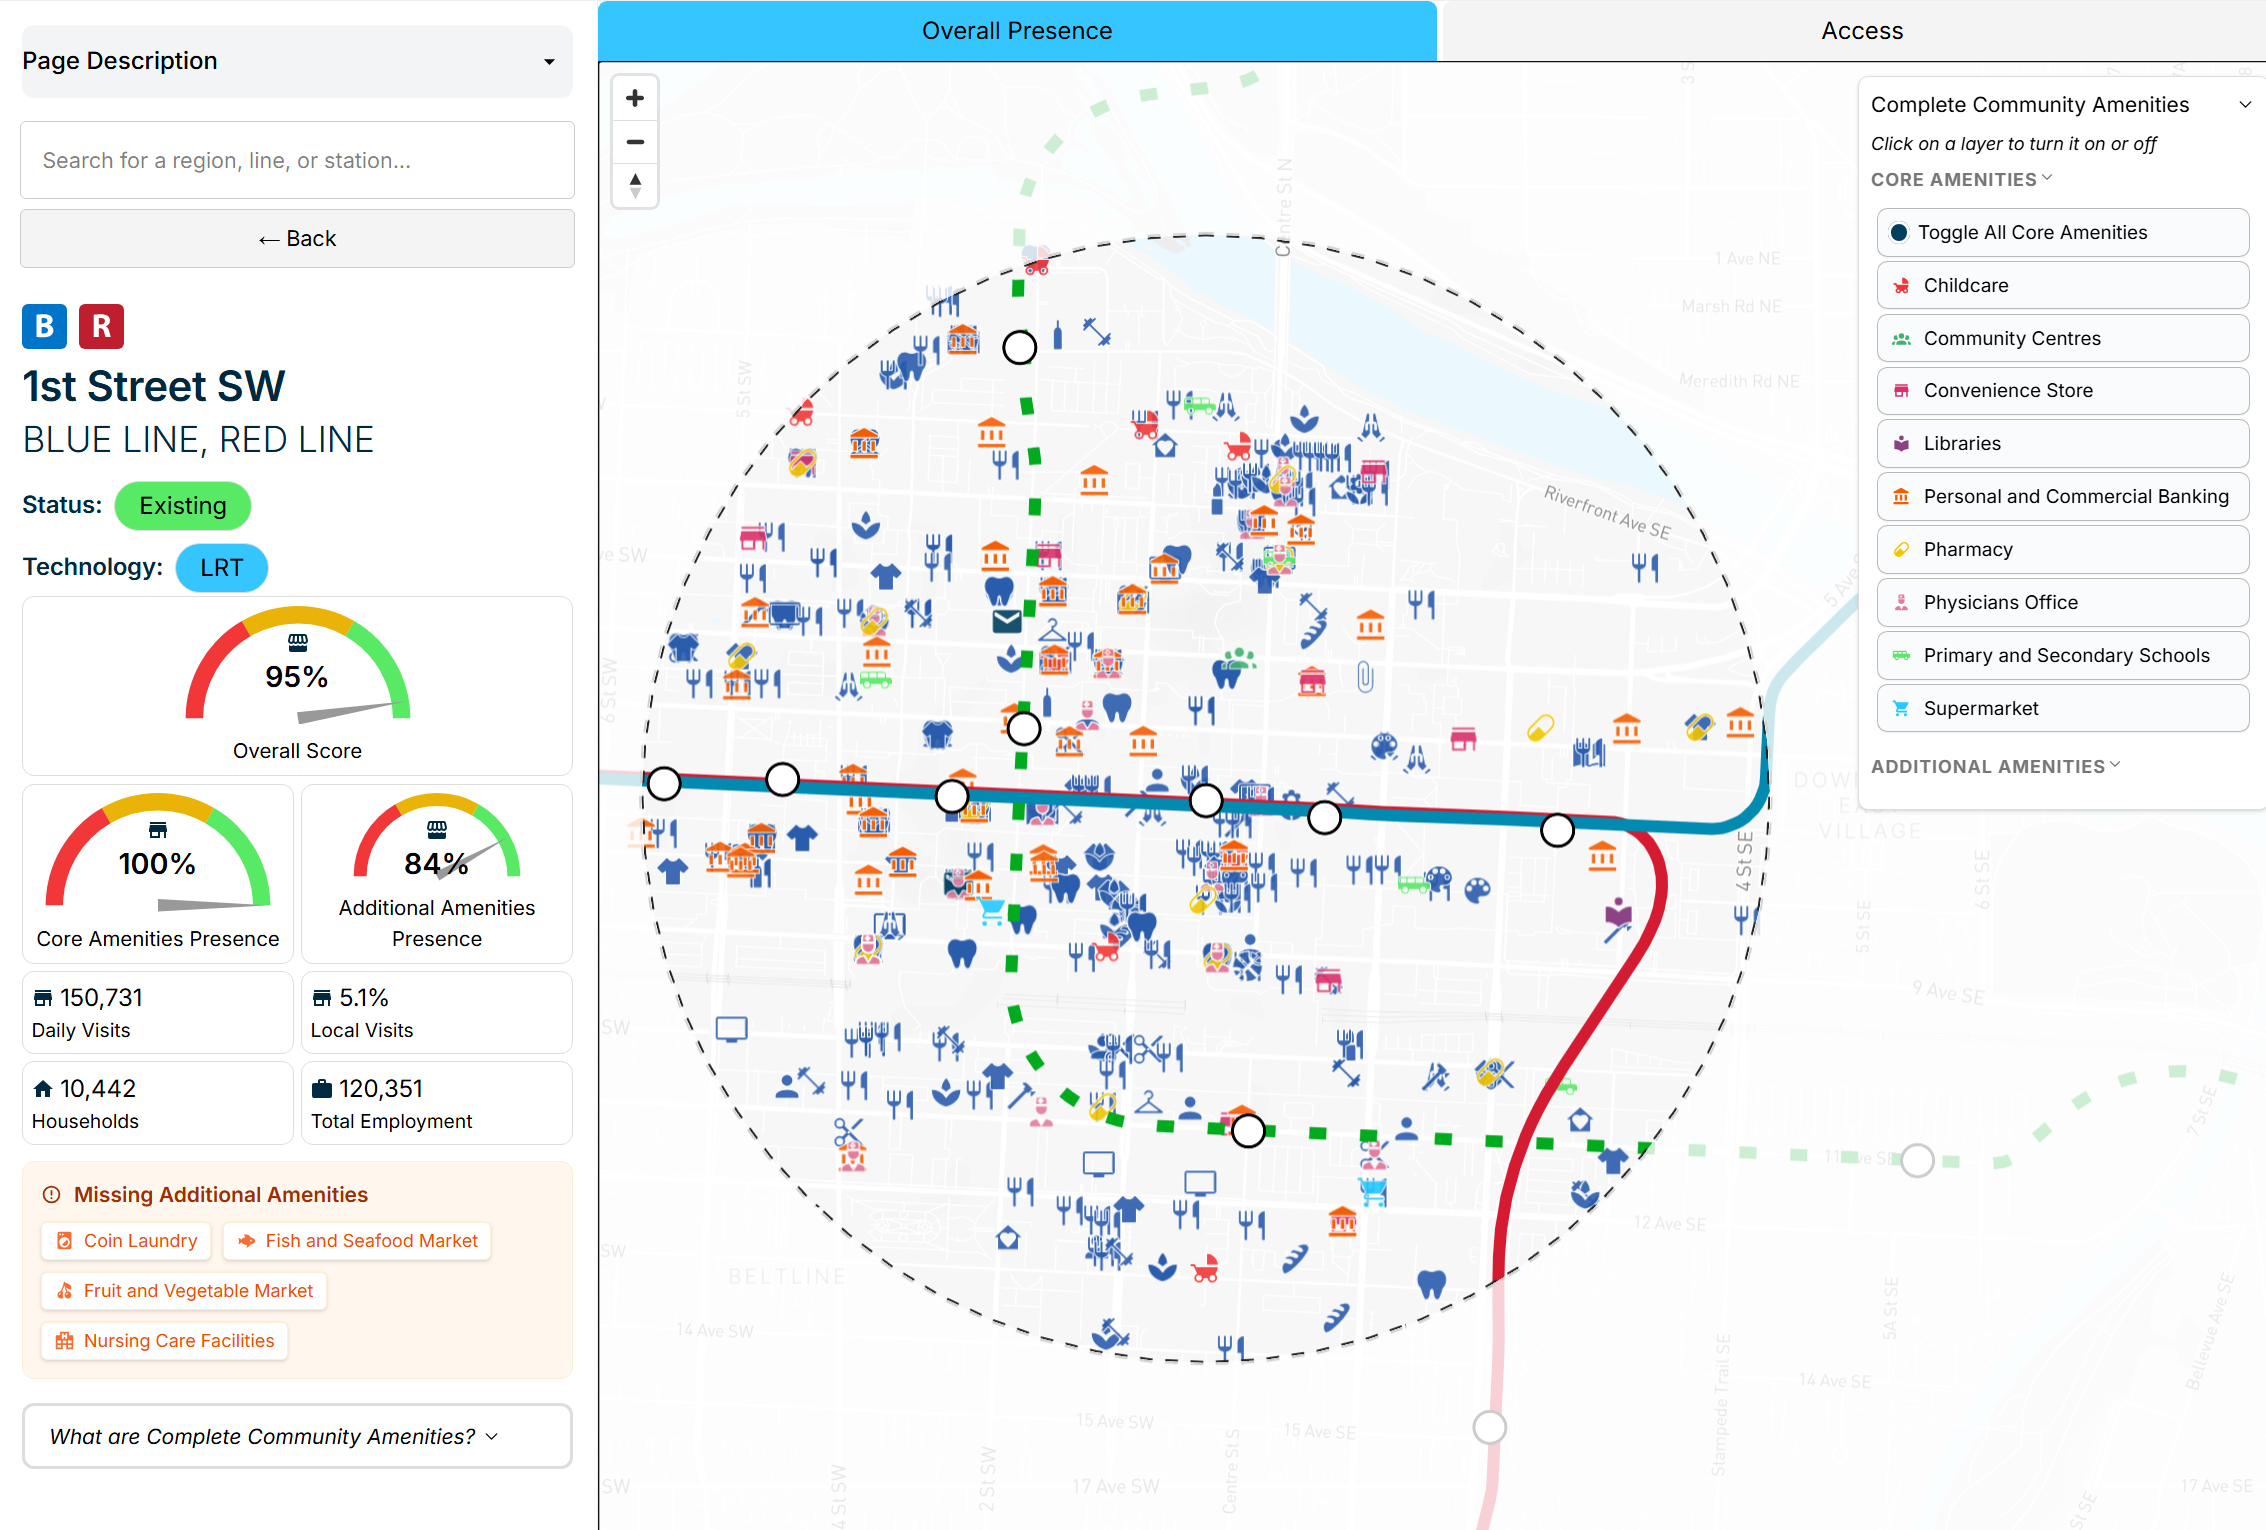
Figure 11a — 1st Street SW, Calgary, with a high Complete Community score
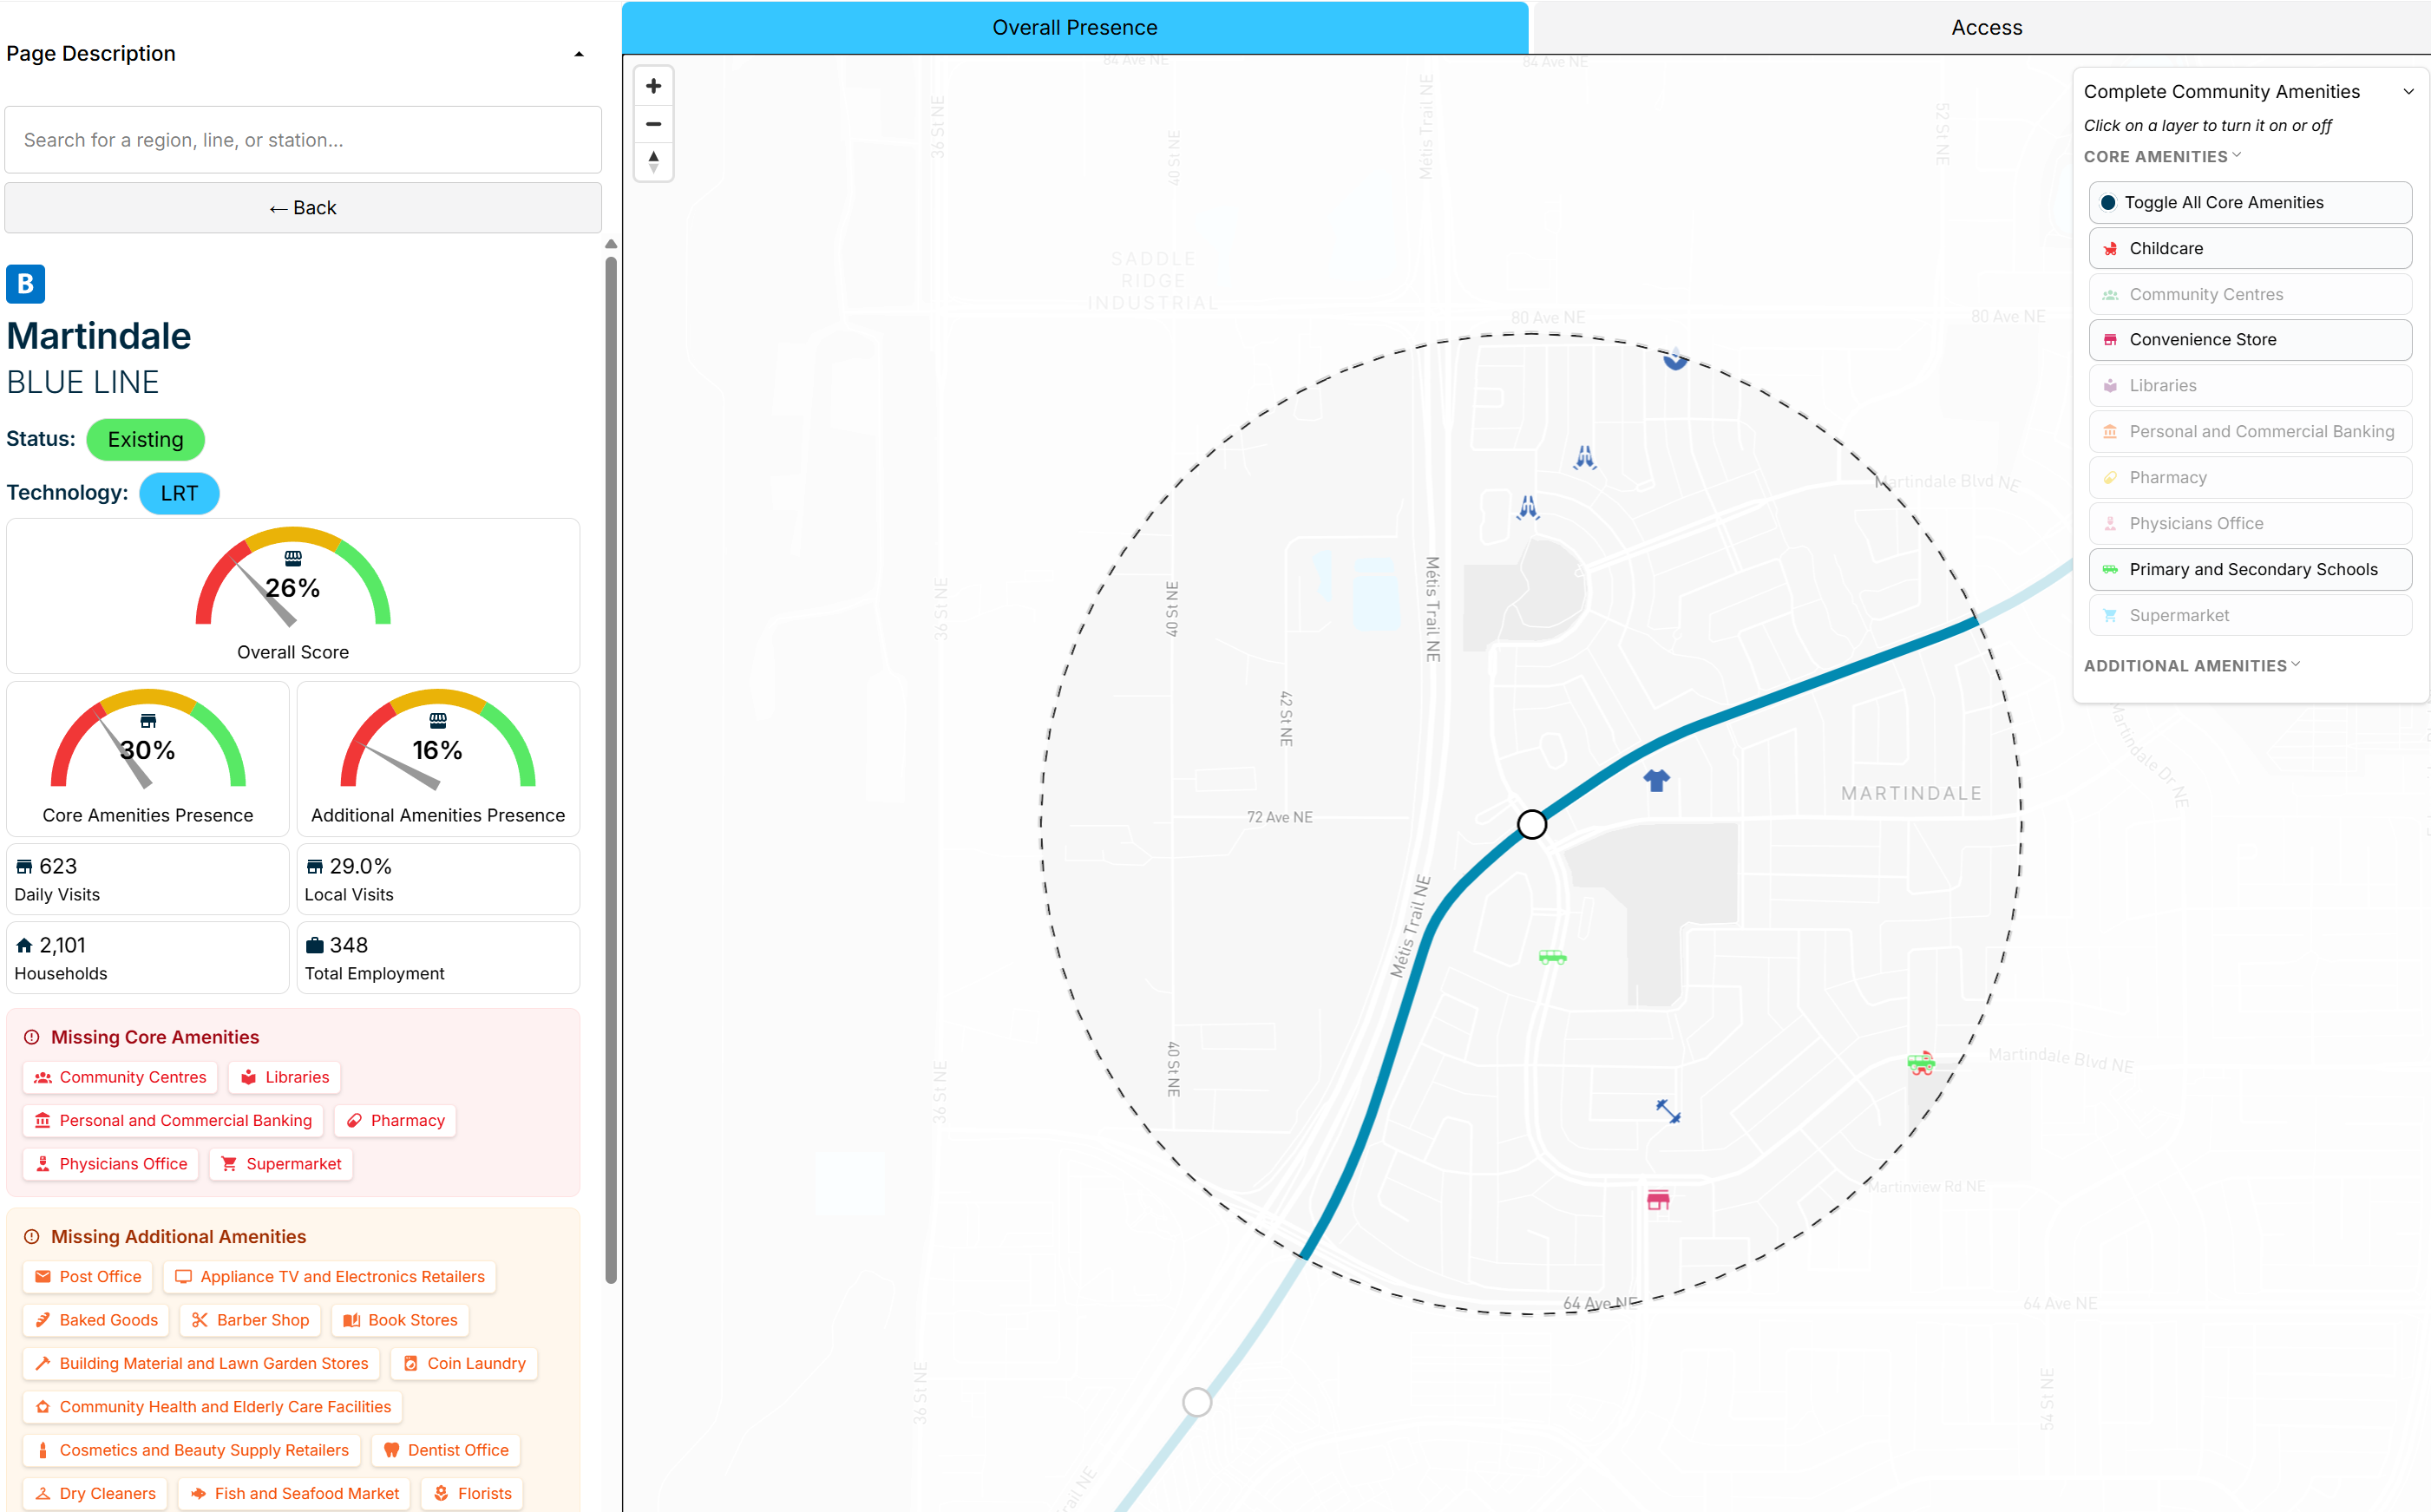
Figure 11b — Martindale, Calgary, with a low Complete Communities score
Communities are only complete if they are walkable
Complete communities may offer people local options for fulfilling their basic day-to-day needs, but the extent to which people make the local choice largely depends on how walkable the community is. Creating dense clusters of amenities, including transit stations is important, but the quality of the public realm that connects them together as well as connects them to where people live is an essential ingredient of a truly functional complete community.
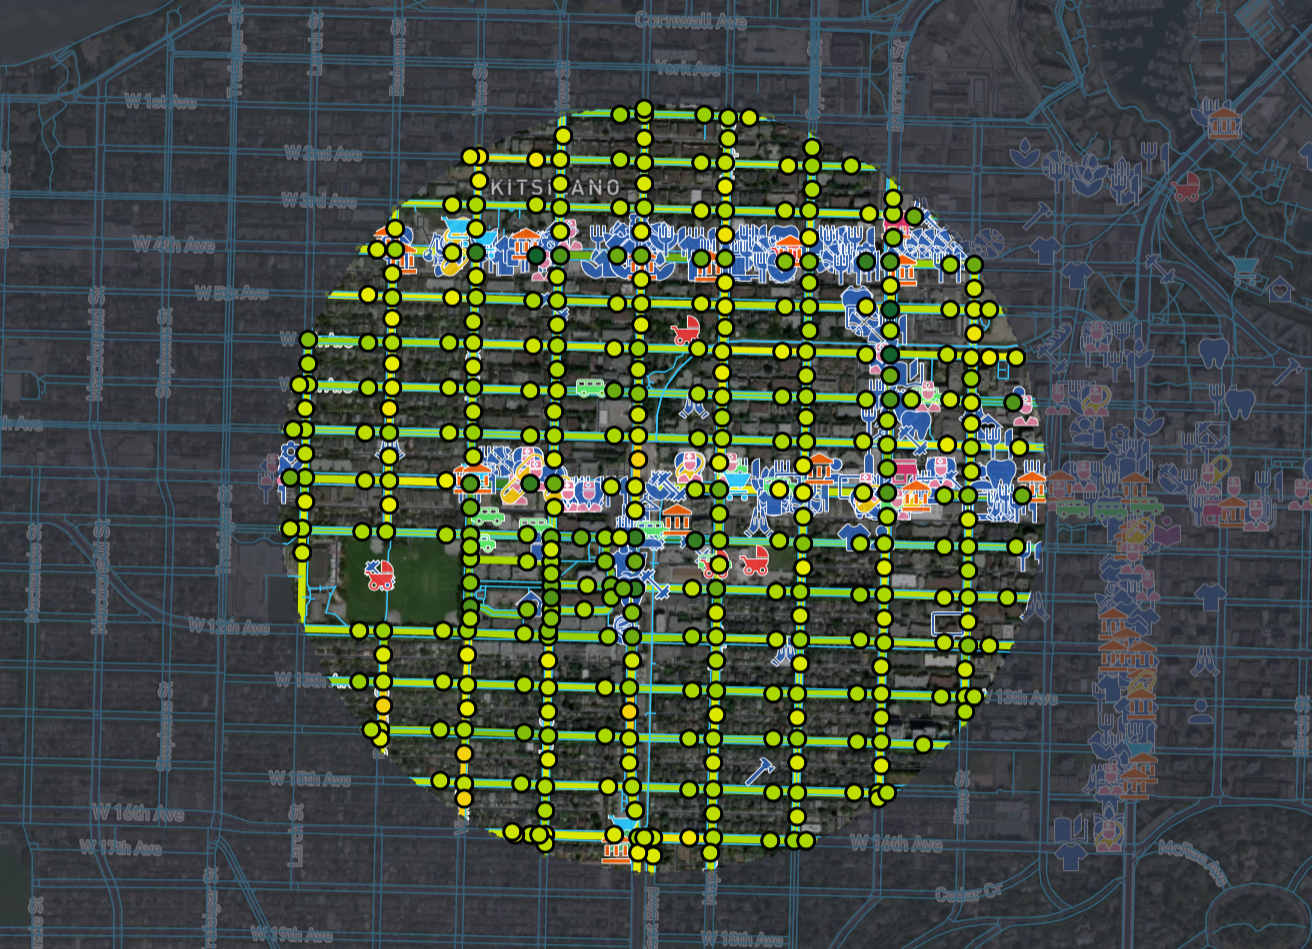
Figure 12a — Arbutus Station, Vancouver, is an example of a highly-walkable transit station.
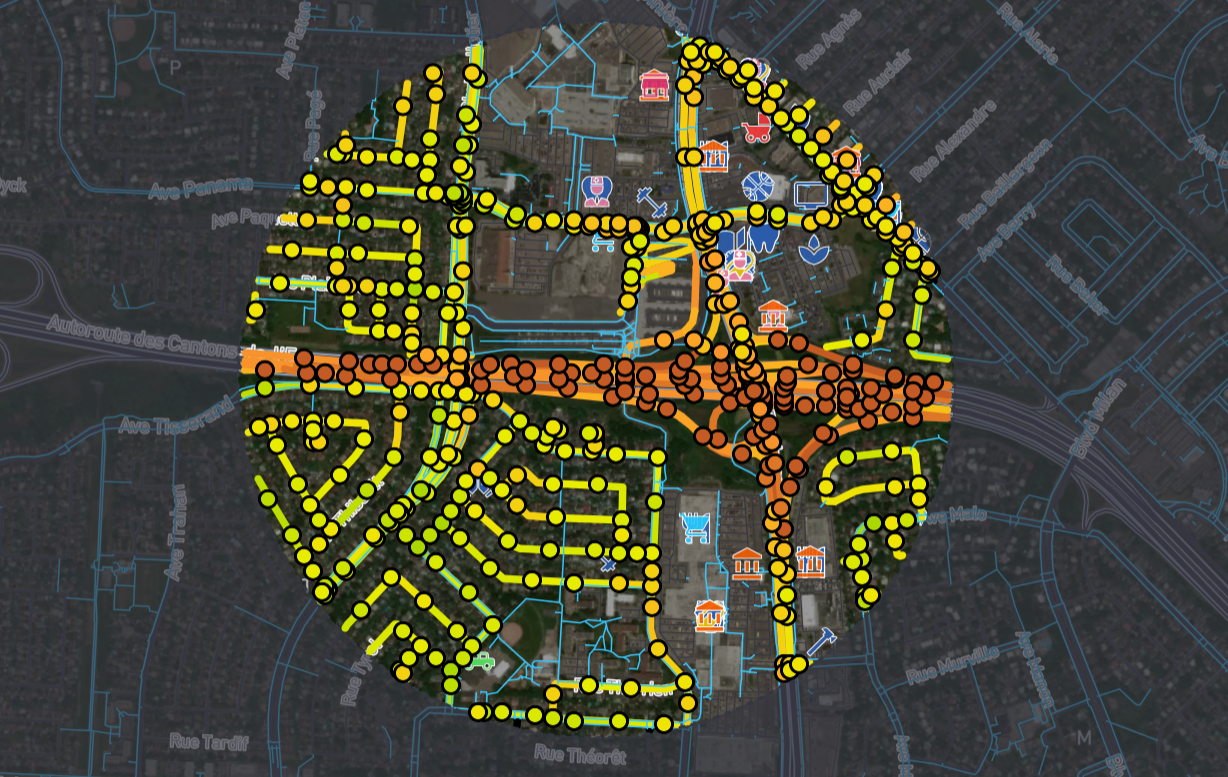
Figure 12b — Panama Station, Montreal, is an example of a transit station with low walkability.
Vibrant main streets are a pillar of walkable neighbourhoods. Crucially, the pedestrian journey to the main street and transit station needs to be safe, pleasant, and accessible for those with personal mobility challenges. Many of the more recent higher order transit investments in Canada are extending outside of downtowns and into suburban environments that were originally built to maximize car travel. It is in these cases where walkability is most often at its lowest. As new transit stations come on stream and new development follows, these neighbourhoods are becoming denser, but they may not become truly urban if the public realm is hostile to active modes of transportation. Planning to retrofit the public realm to work with the additional residents and amenities will be one of the toughest, yet most important challenges associated with transit-oriented developments.
Realizing the benefits of Transit-Oriented Complete Communities
When people have ample amenities in their communities, and the amenities are accessible using active modes of transportation, people are going to experience better outcomes. Dense, walkable, amenity-rich environments can improve residents’ physical and mental health, increase social connection and community, and provide critical mass that support independent main street businesses. Transit-oriented communities improve access to employment opportunities, improve air quality, reduce overall carbon intensity, and can be more fiscally sustainable for local governments. When all these benefits are added together, the case for transit-oriented complete communities is undeniably strong. In addition to transportation gains, careful and thoughtful due diligence on the housing, economic, health, and fiscal improvements resulting from new higher order transit investments should lead to more business cases receiving passing grades.
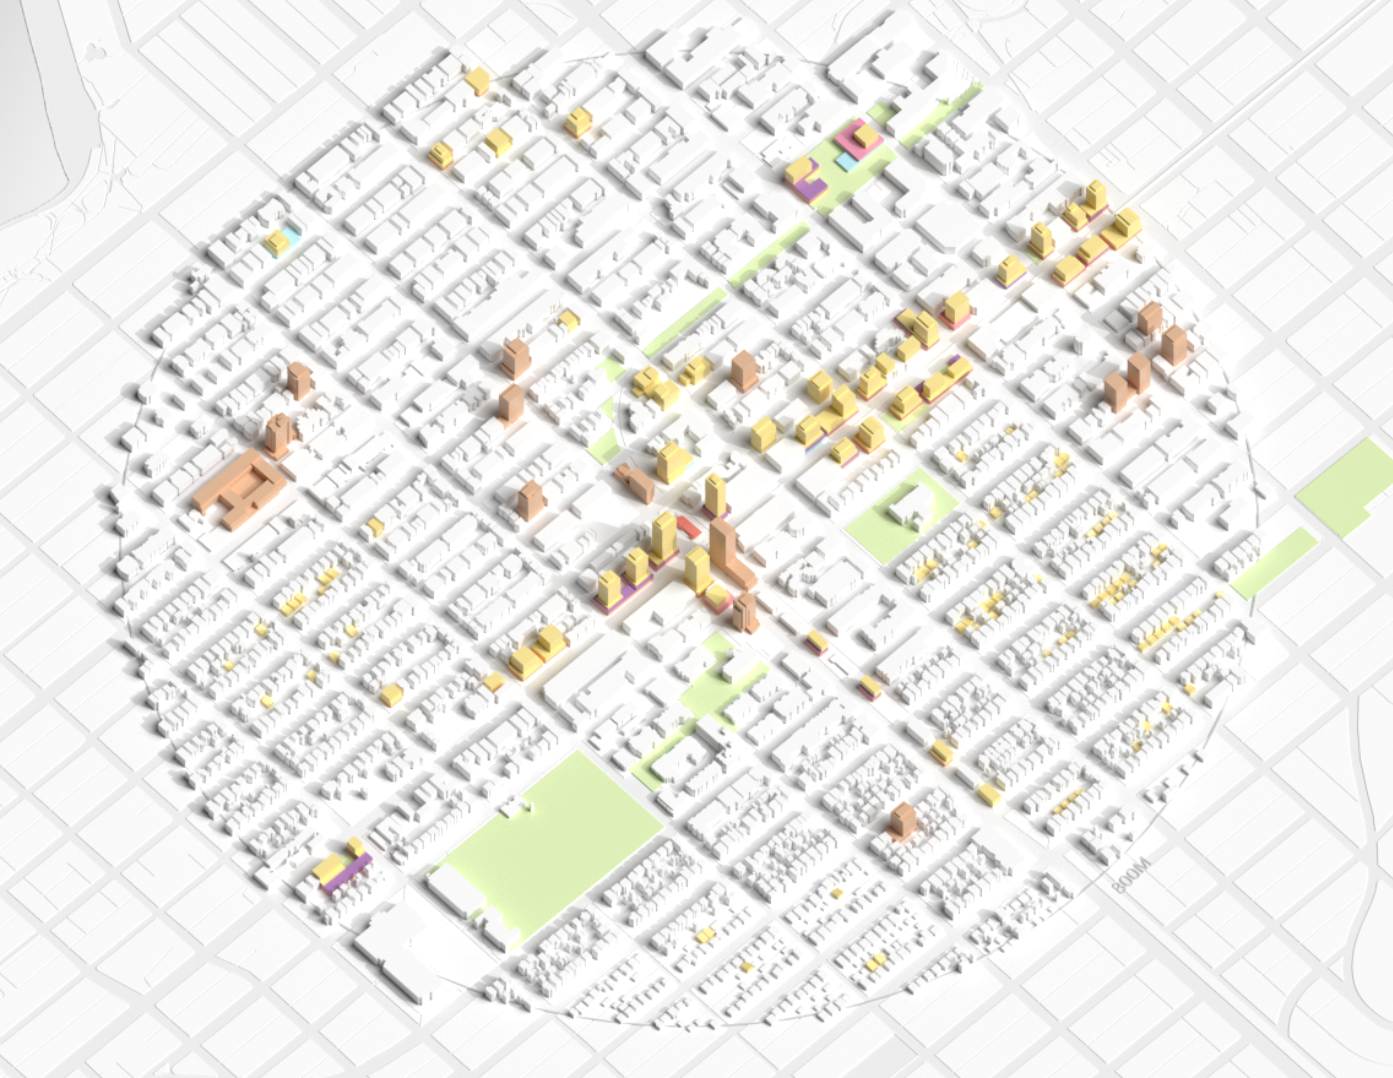
Figure 13 — Rendering of Arbutus Station case study produced by Infrastructure Institute and School of Cities.
Source: https://measuringmainstreets.ca/casestudies/tod/arbutus
Affordability and displacement
Not all impacts of new higher order transit infrastructure projects are positive. New LRT, subway, and commuter rail lines bring significant change to existing communities. Property values typically rise, land is often used for different purposes, and new buildings are constructed in the pace of older ones. When these things happen, residents and businesses can be displaced. Those that experience displacement are most frequently the most vulnerable. It is not just a matter of subtracting individuals from a neighbourhood, but crucially it can strain and sever relationships between people and their connection to a place. Relationships are the foundation of community, and community is the foundation of local resiliency. Transit-oriented development needs to be inclusive. Policies and models of development should limit and mitigate displace impacts as well as provide affordable opportunities for residents from all income levels.
Figure 14 — Screenshot from the "Who Lives in Transit Station Areas? report
Building transit-oriented communities from the ground up
Higher order transit infrastructure does a lot more than simply get people from point A to point B. It is foundational to city-building itself. Where public transit investments go, private investments tend to follow. These investments add up over time to create the densest urban environments in the country and are essential to regional economies. While transit lines stich cities together, every station area is a neighbourhood community itself. When planning and building new transit infrastructure a complete community approach for each stop should lead to more housing and a higher quality of life. New higher order transit infrastructure costs billions of dollars. It is complex work that requires a great deal of expertise and coordination. What cannot be overlooked in the process are the views of the public. What kinds of communities do people want to live in? What kinds of amenities are most important to them? Where do they want to be? Real efforts need to be made to ask these questions so that infrastructure projects ultimately deliver what people want and expect. If we can evolve our thinking from transportation planning to city-building to community building, future residents should be well-served.

Figure 15 — Schreenshot of Digital Public Square community engagement tool.